Launched a month ago, this interactive graph tracks COVID-19 pandemic curves in countries worldwide, with daily updates for easy comparisons.
The global COVID-19 toll now exceeds 2.5 million cases and 170,000 deaths. Johns Hopkins University's dashboard offers real-time tracking, complemented by this Visual Capitalist chart from March 16, 2020, using European Centre for Disease Prevention and Control (ECDC) data.
Refreshed daily, it supports multi-country overlays or continent-wide views. Tests show Italy, Spain, France, and Germany tracing nearly identical paths.
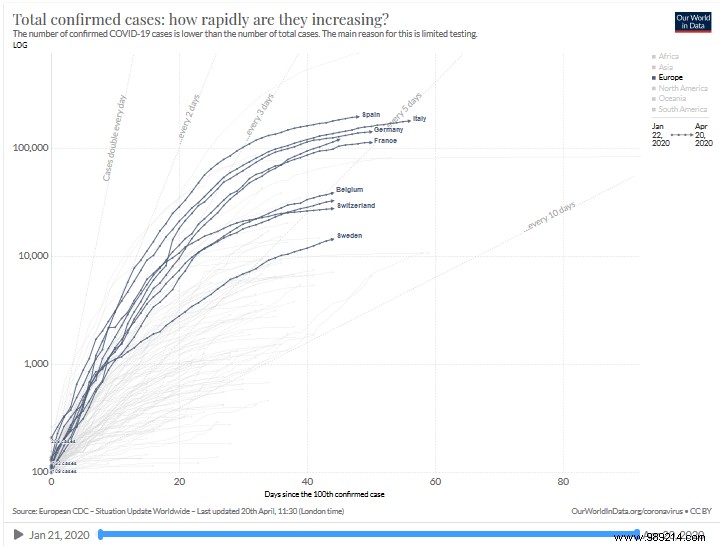
These curves track confirmed cases from December 31, 2019—note the absence of death trends.
Visual Capitalist warns of doubling rates overwhelming health systems. Europe's strained services underscore risks, especially in resource-limited Africa.
Nations counter with social distancing, remote work, school closures, gathering limits, and lockdowns like France's to stagger infections.
View the interactive graph here: